I think for the question you can think of a regular cos graph for the flux, then you shift it by pi cause the normal of the armature starts perpendicular to the mangetic field which gives a -sin graph.
This means that the flux is decreasing at a decreasing rate intially as t increases. Hence

is negative when the motor starts. This means that emf is initially positive and starts at a maximum instead of a minimum.
Alternatively you could derive the equation itself... (hopefully I didn't make any mistakes)
Starting off with the equation

assuming that the number of coils is one.
using chain rule


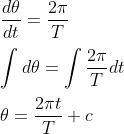
since the armature of the motor rotates 2pi every period

Therefore

However the graph is in terms of time therefore we must make it in terms of time

At t=0 the angle is pi as we take the angle from the normal when calculating magnetic flux
hence c=pi
therefore
)
)
hence we get a positive cos graph shape not a negative.